Working with Tags in Azure Resource Graph Explorer
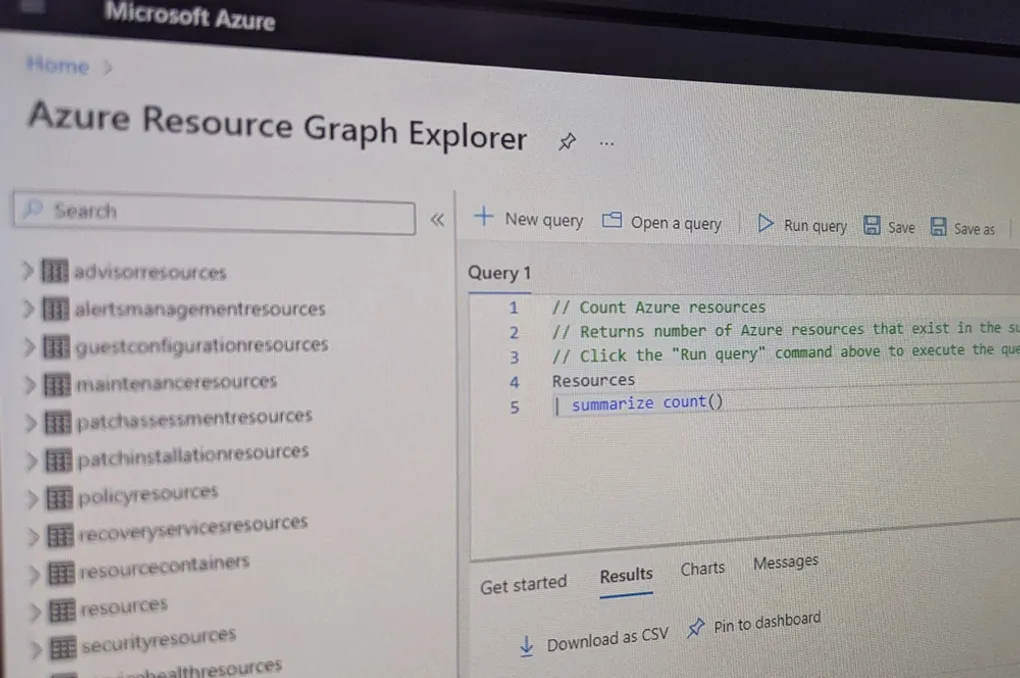
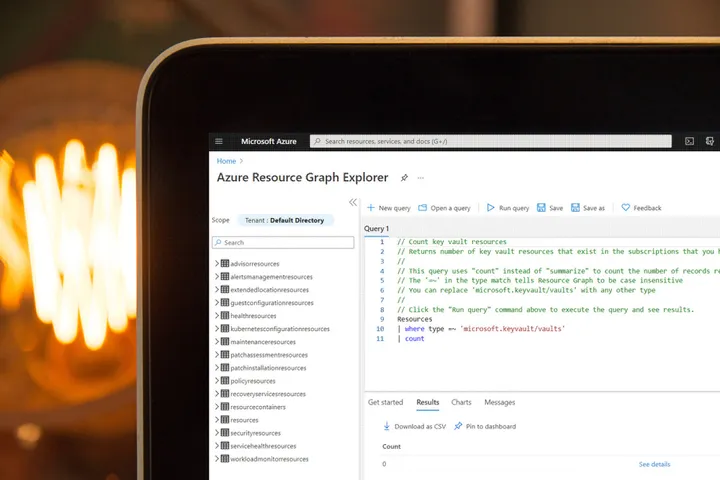
Azure Resource Graph Explorer is a great tool for querying your Azure resources. Through queries, you can quickly produce tables and charts that can then either be downloaded or displayed on an Azure Dashboard. The queries are written in Kusto Query Language (KQL) and many example queries can be found on the Microsoft Docs website. One of the less intuitive scenarios however arises when working with tags.
Tag Queries
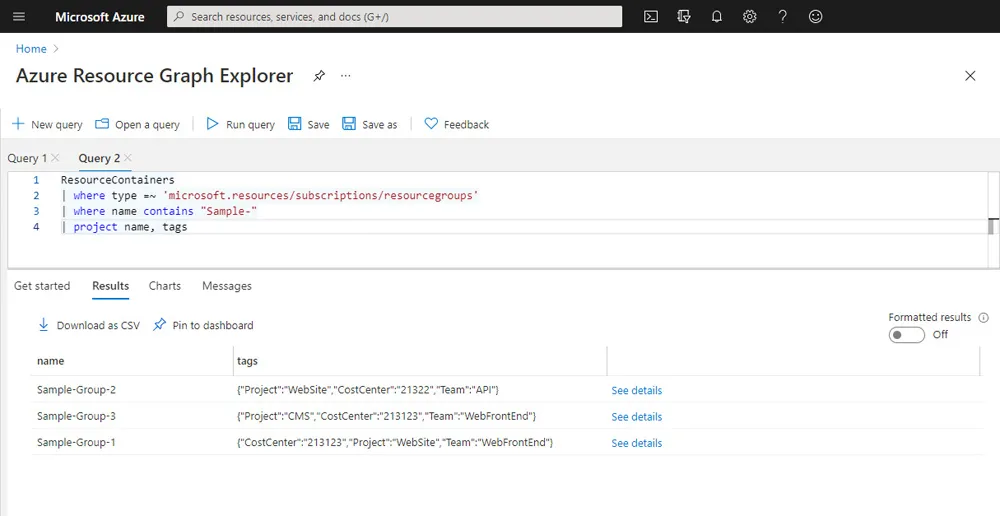
When you create a query that returns tags the data comes back as a block of JSON inside a single column. This means you cannot filter, or aggregate data based on a individual tags.
Using mvexpand
The first step in solving this issue is the mvexpand operator. This operator is the opposite of the summarize operator and will break out each tag into separate rows.
ResourceContainers
| where type =~ 'microsoft.resources/subscriptions/resourcegroups'
| mvexpand tags
| project name, tags
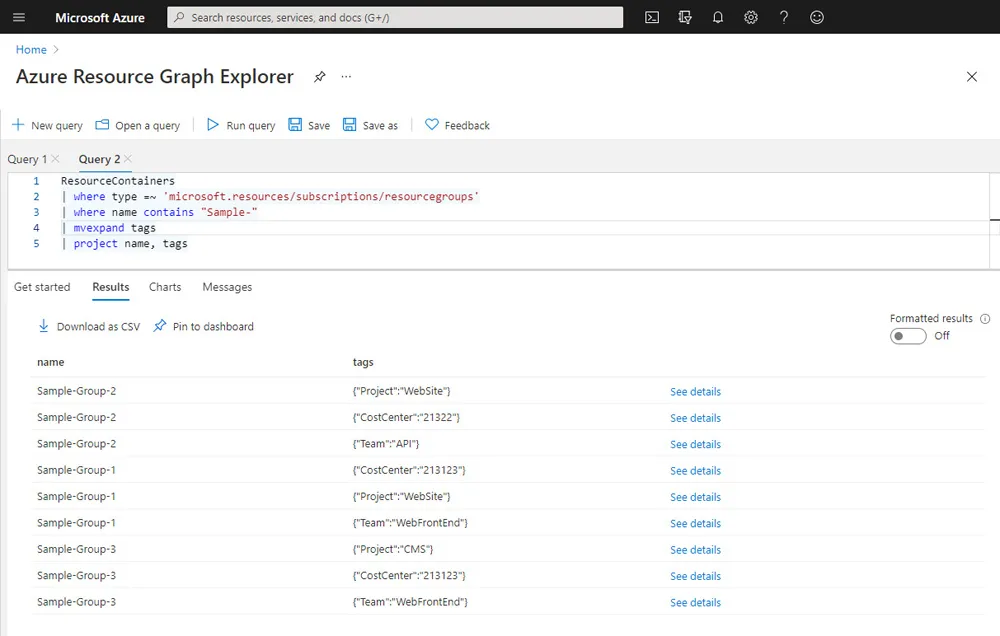
At this point however, the data is still in JSON and you cannot apply any further checks on it or use it in graphs.
Using extend
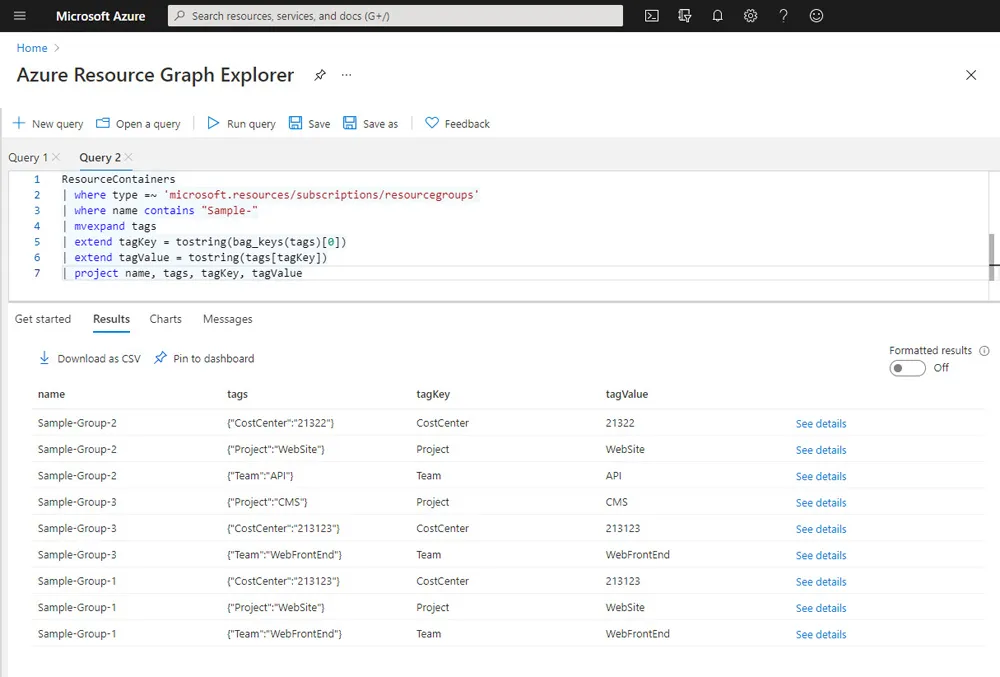
The next step is to use the extend operator. This operator is used to add calculated columns to your result set. In our case using this will allow us to read the JSON data from the expand and format it so it becomes plain text.
ResourceContainers
| where type =~ 'microsoft.resources/subscriptions/resourcegroups'
| mvexpand tags
| extend tagKey = tostring(bag_keys(tags)[0])
| extend tagValue = tostring(tags[tagKey])
| project name, tags, tagKey, tagValue
Tag Filters
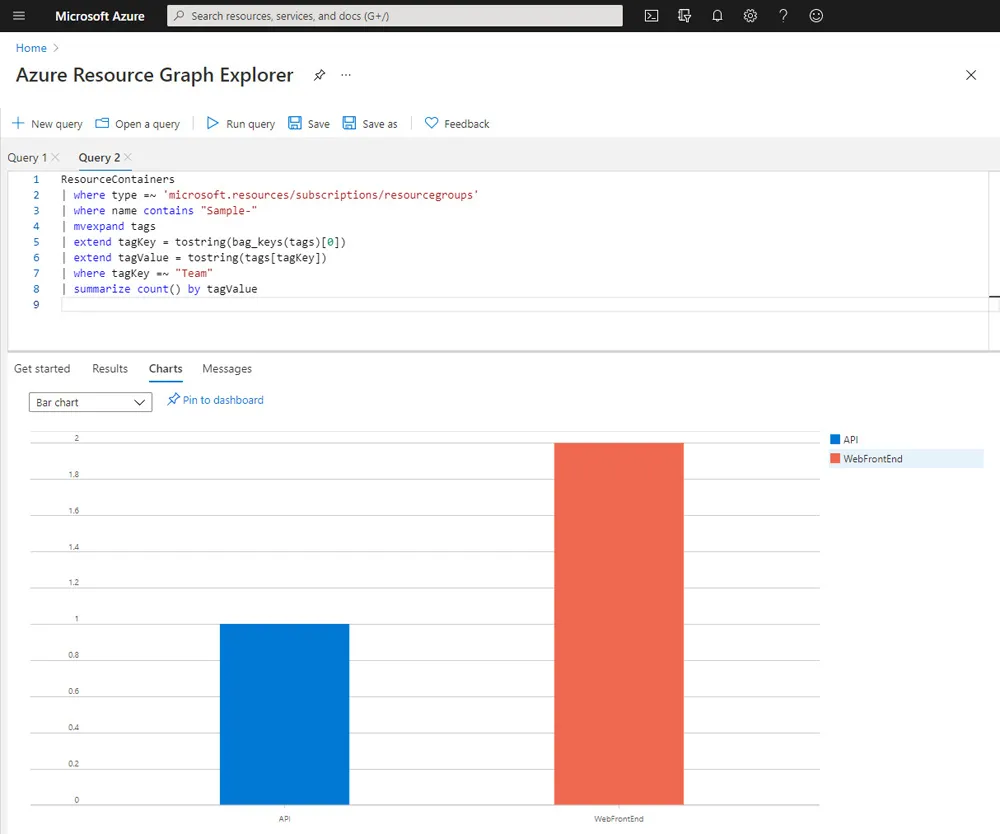
Now the tag data is in plain text columns we can filter to discard values and then apply a group on the values. The resulting data can be shown as a chart can be pinned to an Azure dashboard.
ResourceContainers
| where type =~ 'microsoft.resources/subscriptions/resourcegroups'
| mvexpand tags
| extend tagKey = tostring(bag_keys(tags)[0])
| extend tagValue = tostring(tags[tagKey])
| where tagKey =~ "Team"
| summarize count() by tagValue
Summary
Azure Resource Graph Explorer is a powerful tool however in some queries it will return JSON data inside a single column. In this post we looked at how can use the mvexpand and extend operators to take JSON columns and extract both the key and values. From this we are then able to filter and aggregate the data to create charts.