3 Ways to Export Metrics from Azure for Unlimited Retention

Metrics in Azure are a part of the Azure monitor service. This service automatically captures many different numerical data points from your Azure infrastructure, aggregated over time, storing them in a database. In most cases standard metrics are stored automatically with no ingestion cost for a fixed 90 days. In this post we will cover how we can store these metrics far beyond this limit and provide access to other systems.
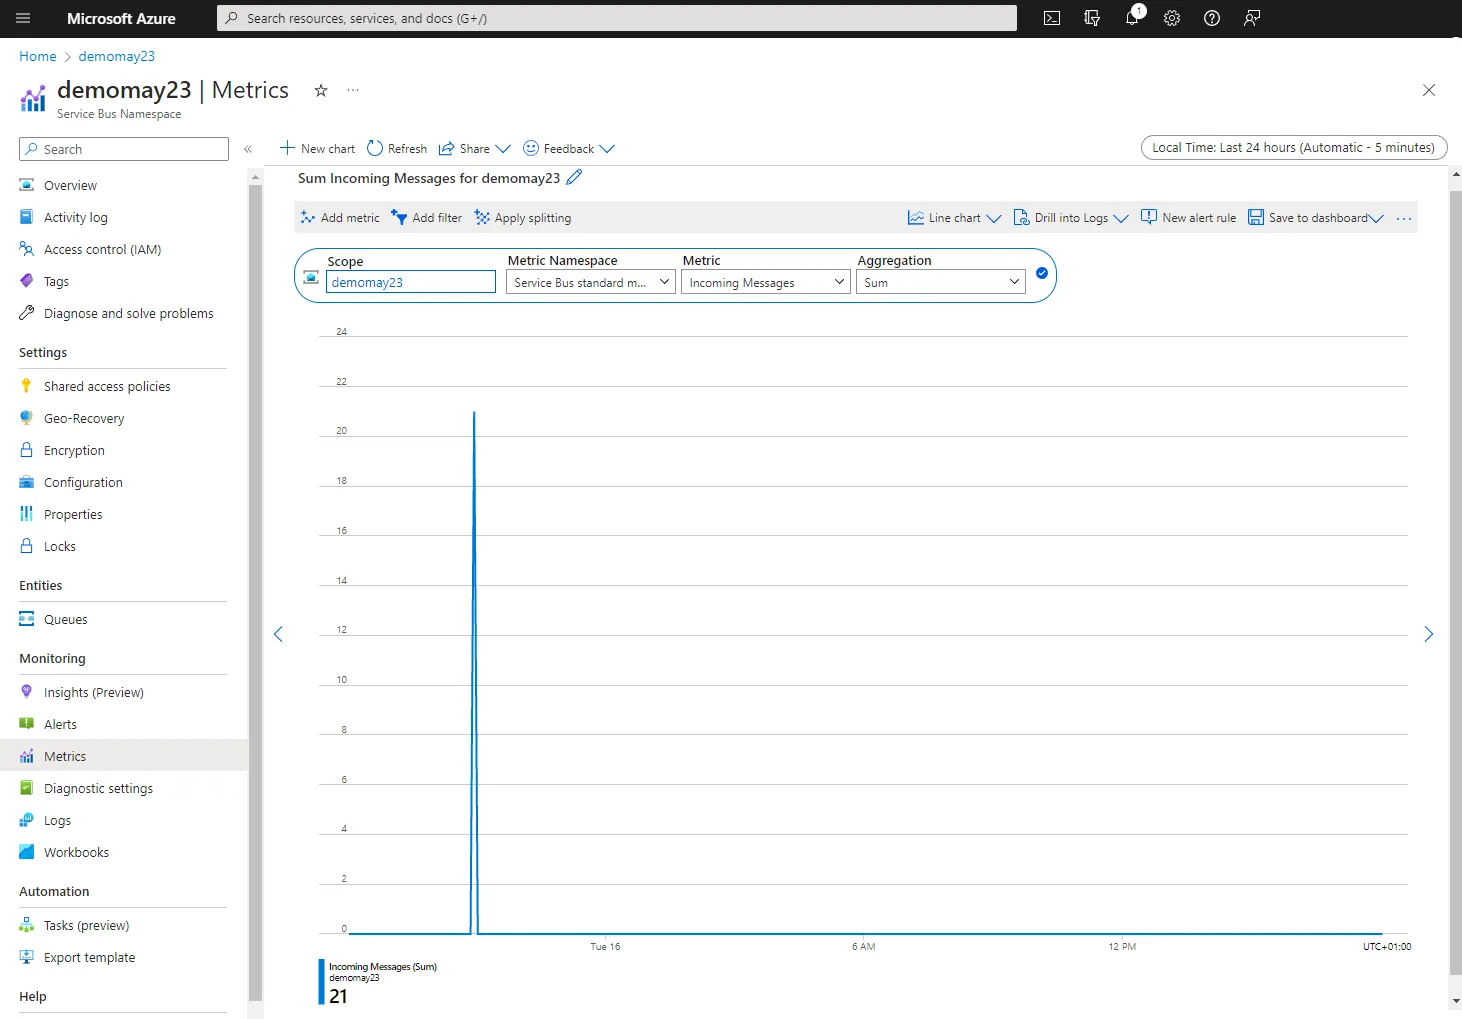
There are many different types of standard metrics captured. Depending on the resource depends on the metrics available. For example, from a virtual machine you’ll be able to see metrics like CPU and memory usage, while an Azure service bus captures metrics such as queue lengths. You are also, at an additional cost able to add in custom metrics. It is then possible to review both of these types of metrics in the Azure metrics explorer.
For more information on Azure Monitor Metrics see the official Microsoft documentation.
Continuous Export
A continuous export is a great option for long term backup or continual ingestion into another service. It is quick and easy to set up and it has many configurable options.
To set up an export, in the Azure portal on the left-hand menu of any resource that is collecting metrics, directly beneath the Metrics Explorer option you will find the Diagnostic Settings.
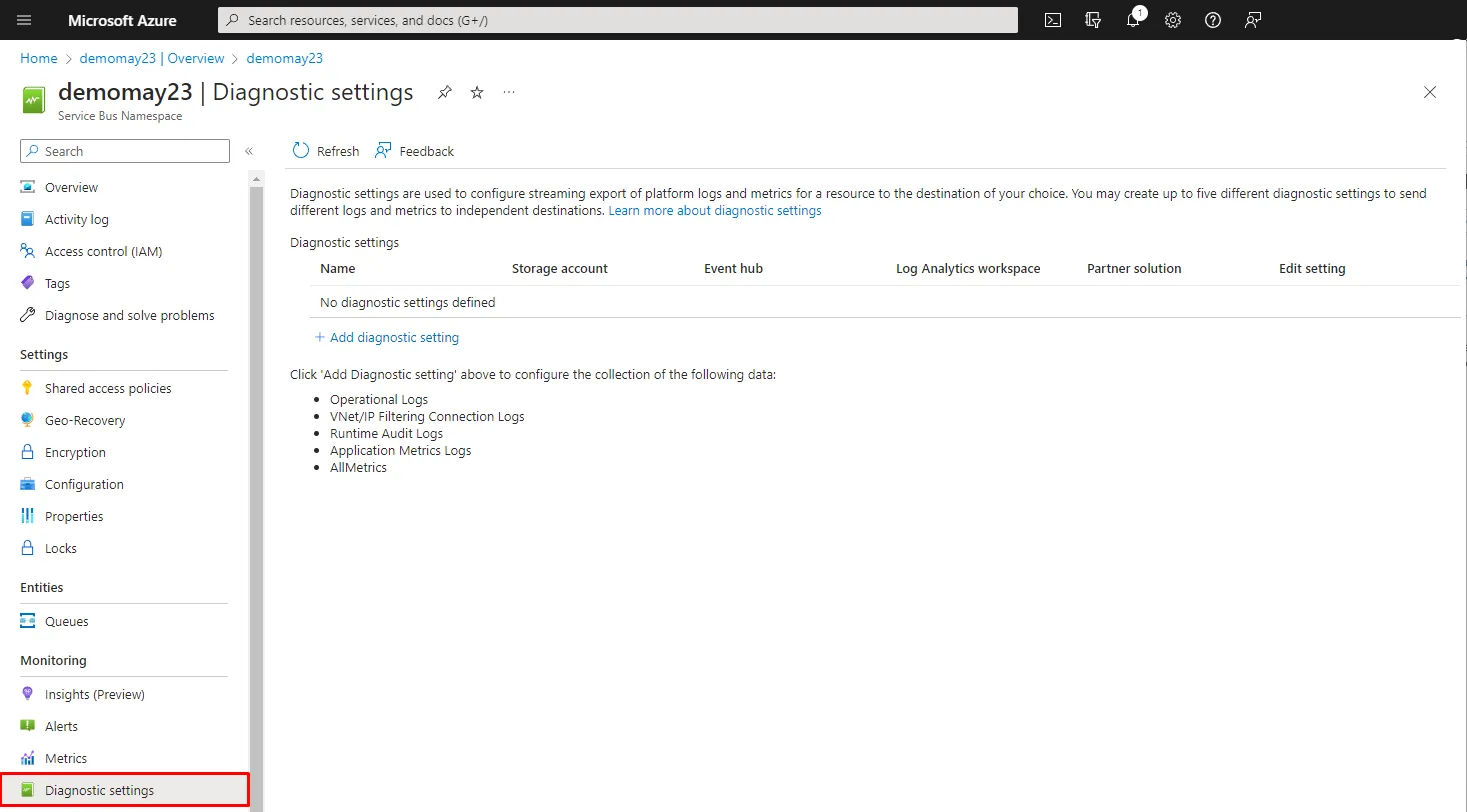
Adding a new diagnostic setting allows us to configure an export of the metrics we can see in the metrics explorer. We can then send this data to a log analytics workspace for further analysis, archive it to a storage account, stream the data to an event hub to send to other locations or send directly to a partner solution.
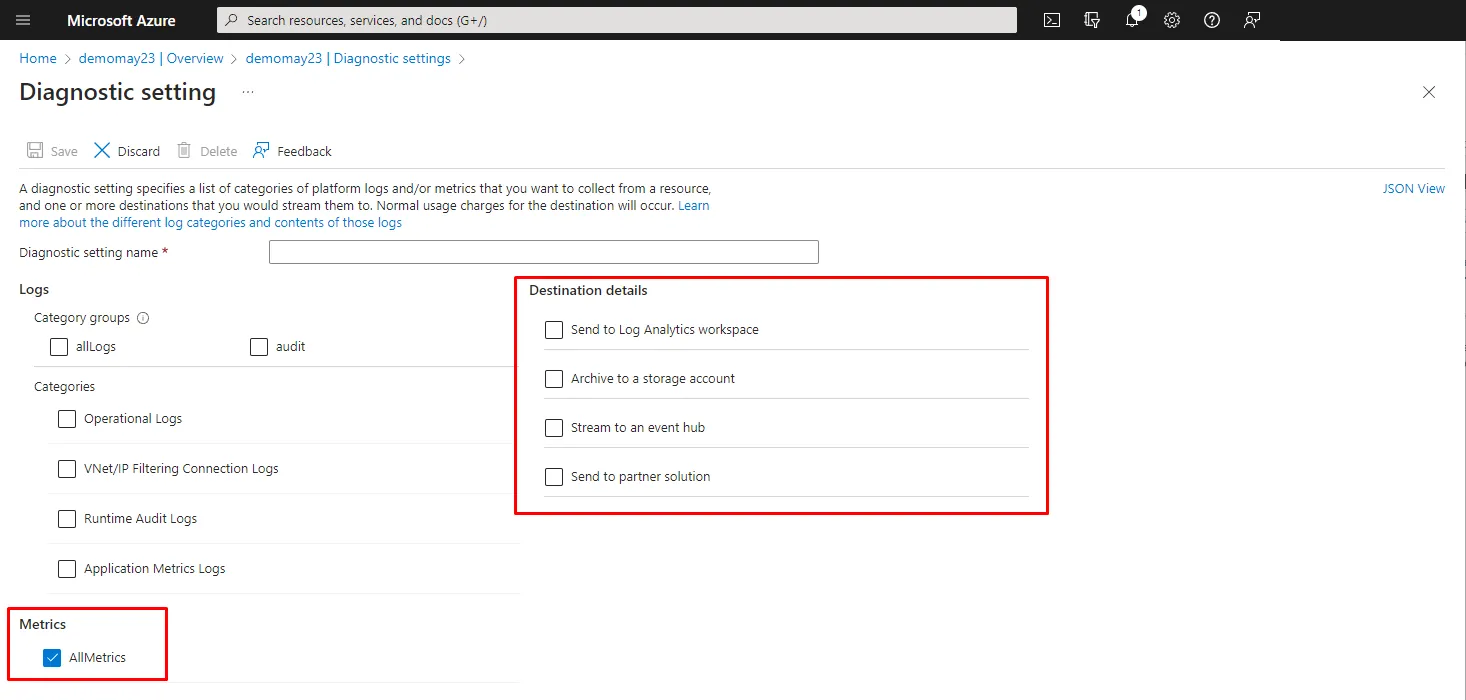
If we select to export to a storage account, we have an additional option of how long we wish to retain the data for, either unlimited duration or between 1 and 365 days.
More information can be found on the Diagnostic settings page
Custom Export via APIs
Sometimes we need to extract data for a particular time period without running a continuous export. I had this need when creating a year on year comparison table. Luckily there is an Azure Monitor Rest API that gives access to all the same data you can see inside the metrics explorer in the Azure portal.
As with many of the Azure APIs we first need to create a service principle that will grant access to read the metrics. We can use this to get an access token for calling the API.
Each of the API requests are based on the resource ID of the Azure resource in the URL which can be found in the portal. This is usually under the Properties or Endpoints menu option of the resource.
Finally, we can then apply filters to extract the data we require. All data is returned in JSON which we can then manipulate or stored. Full details can be seen on the MS learn page
Custom Export via SDKs
Although the rest APIs are flexible, they do require working with raw HTTP requests and parsing the JSON responses. There are however several SDK packages that wrap the API allowing us to access the metrics data in a more familiar way, utilising a more integrated authentication mechanism. Libraries are provided for Python, Java, JavaScript and .Net
Below you can see how we can use the .NET SDK to export the total scheduled and active messages in an Azure service bus over a 24 hour window using C#. The SDK allows us to use an Azure credentials object meaning we can use a Visual Studio or Az CLI login locally to authorise. Then we can use a managed identity and our deployed solution.
Just like in the rest API we must access the resource with a resource ID. We can then run a query looping through each of the metrics and the time points in the results. In this sample we then output the results to a string builder to save into a CSV file.
var sb = new StringBuilder();
var metricsQueryClient = new MetricsQueryClient(new DefaultAzureCredential());
var resourceId = $"/subscriptions/{_subscriptionId}/resourceGroups/{_resourceGroupName}/providers/Microsoft.ServiceBus/namespaces/{_serviceBusName}";
var metrics = new[] { "ScheduledMessages", "ActiveMessages" };

var results = await metricsQueryClient.QueryResourceAsync(
      resourceId,
      metrics,
      new MetricsQueryOptions()
      {
          Aggregations = { MetricAggregationType.Total },
          Filter = "EntityName eq '*'",//this is the same as a split in the UI
            TimeRange = new QueryTimeRange(
                    new DateTimeOffset(2023, 1, 1, 09, 00, 0, TimeSpan.Zero),
                    new DateTimeOffset(2023, 1, 1, 10, 00, 0, TimeSpan.Zero))
      }
  );

foreach (var metric in results.Value.Metrics)
{
    foreach (var element in metric.TimeSeries)
    {
        var queueName = "Unknown";
        if (element.Metadata.ContainsKey("entityname"))
        {
            queueName = element.Metadata["entityname"];
        }
        else if (element.Metadata.ContainsKey("EntityName"))
        {
            queueName = element.Metadata["EntityName"];
        }

        foreach (var metricValue in element.Values)
        {
            sb.AppendLine(
                $"{metricValue.TimeStamp.ToString("yyyy-MM-dd HH:mm:ss.fff")},{queueName},{metric.Name},{metricValue.Total}");
        }
    }
}

return sb.ToString()
Summary
There are many options for exporting our metrics data. In this post we talked about what Azure metrics are, before looking at three alternative ways of exporting the data to go beyond the 90-day retention period.
We first looked at continuous export allowing us to push data to either a storage account event hub or one of many other services. Following this we took a look at the rest API, allowing us to be more selective over the data we export. Finally, we looked at the set of provided SDK which allowed us to use our favorite languages to access the metric data.